
Exchanges See Bitcoin Outflows For 7th Straight Day As BTC Price Begins Recovery

On-chain data shows exchanges have observed Bitcoin outflows for the seventh consecutive day as BTC’s price starts recovery.
A Net Amount Of Bitcoin Exited Exchanges In The Past Week
As pointed out by a CryptoQuant post, exchanges have seen BTC outflows for seven straight days in the last week.
The relevant indicator here is the “all exchanges netflow.” This metric shows the net amount of Bitcoin entering or exiting wallets of all exchanges. Its value is calculated by taking the difference between the inflows and the outflows.
When the netflow has positive values, it means there were more inflows happening during the period compared with the outflows. Such a trend may be bearish for the crypto as investors usually send their coins to exchanges for withdrawing to fiat or for purchasing altcoins.
On the other hand, if the indicator has negative values, it implies more Bitcoin was exiting exchanges than the amount entering them. This kind of trend can turn out to be bullish for the coin as investors usually take out their coins for hodling or for selling through OTC deals.
Now, here is a chart that shows the trend in BTC netflow over the last couple of months:
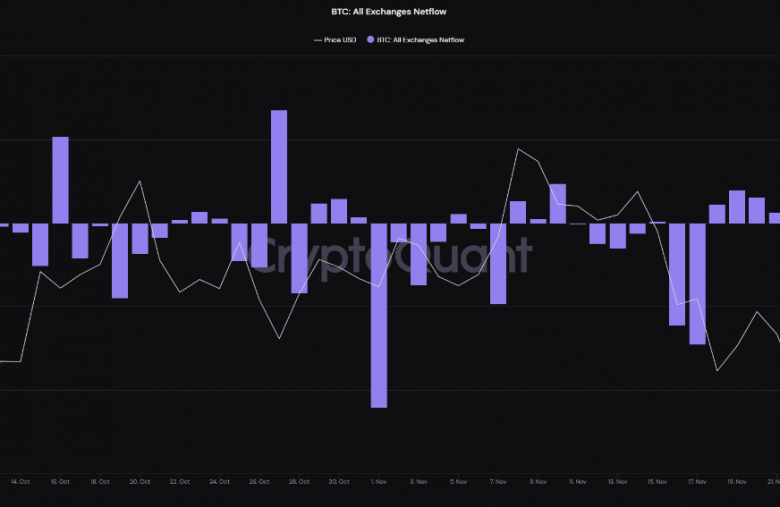
Looks like the indicator has shown negative values recently | Source: CryptoQuant

As the above graph shows, today was the seventh day in a row that exchanges observed negative Bitcoin netflows. These outflows have varied from as low as 1500 BTC, all the way to 10450 on the other end.

Prolonged outflows can be quite bullish for the crypto in the long term as it leads to lesser supply for selling on exchanges.
The indicator that measures the total supply on exchanges is called the “exchange reserve.” For quite a while now, the value of this metric has been gradually going down, and these recent outflows are just a continuation of that trend.

This downtrend in the reserve may be creating a supply shock in the market, and due to supply-demand dynamics, such a situation can be bullish for the coin’s price.

BTC Price
At the time of writing, Bitcoin’s price floats around $57.2k, down 2% in the last seven days. Over the past thirty days, the crypto has lost 5% in value.

The below chart shows the trend in the price of BTC over the last five days.
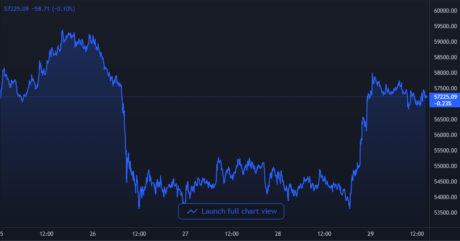
Bitcoin may have started on the path to recovery now as the price once again revisits above $57k. However, at the moment it’s unclear whether it’s a real recovery or a dead cat’s bounce.
Featured image from Unsplash.com, charts from TradingView.com, CryptoQuant.com